The currency pair EUR/USD showed a new upward movement on Thursday, although there were no fundamental reasons. But they are not required at the moment. The pair has been in a limited price range for over a week. It's not a flat market or a "swing," but a state close to them. In other words, the pair is not attempting to start an upward trend or resume a downward one. All movements in the past week have been completely random and have no foundation. In this mode, the pair can continue trading indefinitely since there are no important topics or events.
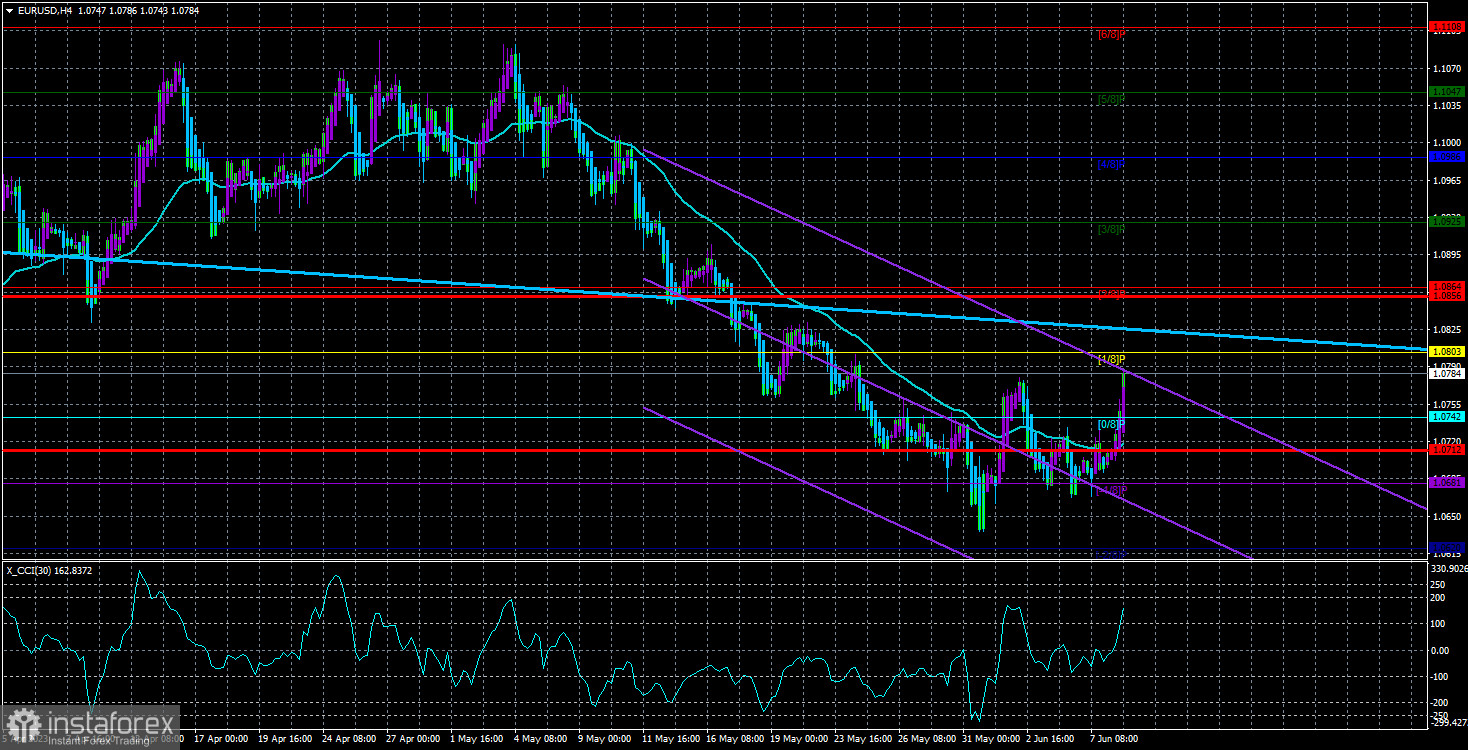
The key reason for the growth of the European currency in the past week is the entry of the CCI indicator into the oversold zone, as seen in the chart above. It is worth noting that this indicator rarely generates signals, but when it does, they have a 90% probability of being strong and accurate. Thus, we can observe a simple oversold recovery of the pair, which has been falling almost continuously for a month. In this case, the pair may continue to rise for some time, for example, towards the level of 1.0864, and then it should resume its decline. There are no grounds for strengthening the euro currency at the moment. The market can always find a reason or an excuse, but considering the current macroeconomic and fundamental background, there are no grounds for growth, at most - a correction.
The GDP in the first quarter is negative.
Earlier, we mentioned that there are no grounds for the growth of the European currency. Yesterday, almost the only report of the day was the GDP in the EU in the first quarter in its third estimate. Traders were expecting zero growth, but the economy contracted by 0.1% quarterly. And this is a very bad sign for the euro currency. But look at how traders reacted to this news. The European currency rose throughout the day. That's all you need to know about the logic of movements at this time. And the decline of the European economy, even a small one, means that the ECB may be much more cautious in its expressions and statements soon. We have already mentioned that the market has priced in 1-2 more rate hikes into the current exchange rate, and these 1-2 hikes have long been taken into account by the market. We cannot expect more now, even without the latest GDP report.
Therefore, no matter what the representatives of the ECB say (and their rhetoric remains largely "hawkish"), we can expect a rate hike of no more than 0.5% to 4.25%. This is a realistic forecast. Naturally, it may change by the end of the summer. Not all factors can be taken into account at the moment. However, even now, we need to have something to rely on. The growth of the euro currency is temporary and purely corrective. And if that's the case, it will end soon.
In the 24-hour timeframe, the pair may stay below the Ichimoku cloud, as it is being squeezed from above by the Senkou Span B line. From this line, the pair may rebound today or at the beginning of the next week, which will be the basis for resuming the downward movement.
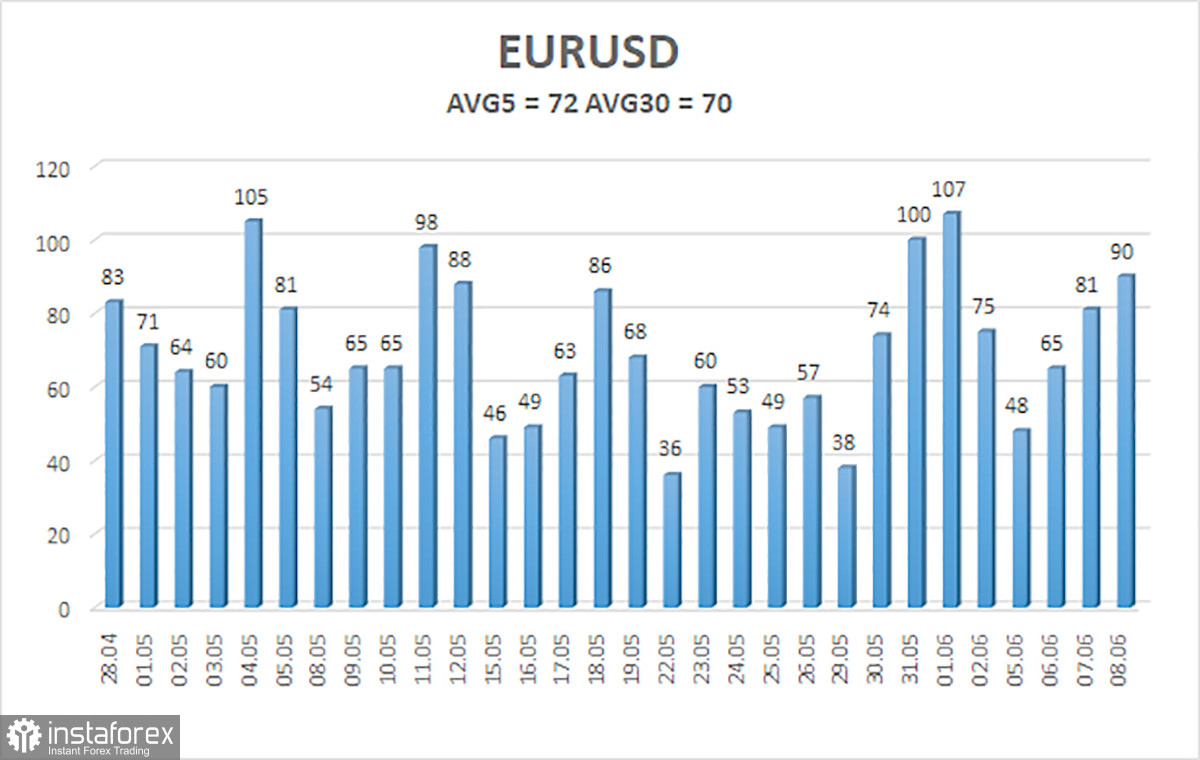
The average volatility of the EUR/USD currency pair over the past five trading days as of June 9 is 72 points and is characterized as "average." Thus, we expect the pair to move between the levels of 1.0712 and 1.0856 on Friday. A reversal of the Heiken Ashi indicator back down will indicate a possible resumption of the downward movement.
Nearest support levels:
S1 - 1.0742
S2 - 1.0681
S3 - 1.0620
Nearest resistance levels:
R1 - 1.0803
R2 - 1.0864
R3 - 1.0925
Trading recommendations:
The EUR/USD pair has settled above the moving average line, but its presence in this area may be short-lived. It is advisable to remain in long positions with targets at 1.0803 and 1.0856 until the Heiken Ashi indicator reverses downwards. Short positions will become relevant again only after the price firmly settles below the moving average line with targets at 1.0681 and 1.0620.
Explanations for the illustrations:
Linear regression channels - help determine the current trend. The trend is currently strong if both channels are directed in the same direction.
Moving average line (settings 20.0, smoothed) - determines the short-term trend and direction for trading.
Murray levels - target levels for movements and corrections.
Volatility levels (red lines) - the probable price channel in which the pair will trade in the next 24 hours, based on the current volatility indicators.
CCI indicator - its entry into the oversold zone (below -250) or overbought zone (above +250) indicates that a trend reversal in the opposite direction is approaching.